Android App Performance & Optimization

Oliver Thomas is a passionate developer and tech writer. He crafts innovative solutions and shares insightful tech content with clarity and enthusiasm.
Client
A large Android application used by thousands of daily users. Over time, users reported performance issues including:
-
Slow startup
-
Lag in lists and UI rendering
-
High memory usage
-
Occasional app freezes
-
App size growing with every release
The client needed a thorough performance optimization effort to make the app faster, smoother, and lighter.
Project Overview
We performed a full performance audit and implemented targeted optimizations across:
-
App size (R8/ProGuard)
-
App startup time
-
RecyclerView rendering
-
Memory usage and leak detection
-
Background task scheduling
-
Overall code refinement
The result was a smaller, faster, and more stable Android application.
Key Challenges
1. Large APK Size
Increasing libraries, resources, and unused code inflated the app size.
2. Slow Startup Time
Initial app launch was delayed due to:
-
Heavy initialization logic
-
Synchronous network calls
-
Large DEX loading
-
Unoptimized dependency injection setup
3. RecyclerView Lag
Scrolling stuttered due to:
-
Inefficient adapters
-
Full list reloads
-
Large data sets
-
Expensive diffing operations
4. Memory Leaks
Frequent leaks caused:
-
High RAM consumption
-
Background activity retention
-
Crashes on older/lower-memory devices
Our Solution
1. App Size Reduction Using ProGuard and R8
We enabled and fine-tuned:
-
Code shrinking
-
Resource shrinking
-
Unused method and class removal
-
Obfuscation for security
-
Optimization passes in R8
-
Split APKs / App Bundles
Results:
-
APK size reduction by 25–45%
-
Faster downloads and updates
-
Lower installation failures on low-end devices
2. Improving Startup Time Through Profiling
We profiled the startup using:
-
Android Studio Profiler
-
Startup Tracing
-
Perfetto
-
Systrace
Improvements included:
-
Lazy initialization for SDKs
-
Deferring heavy work to background threads
-
Removing synchronous calls from Application.onCreate
-
Optimizing dependency injection graph (Hilt/Dagger)
-
Reducing splash screen overhead
Result:
-
Cold start time reduced significantly
-
Noticeable improvement in first-screen load
3. Optimizing RecyclerView Performance
We introduced the following improvements:
DiffUtil
-
Only updates changed items
-
Removed full list redraws
-
Smooth UI updates even on thousands of items
Paging Library / Pagination
-
Only fetch small chunks of data
-
Reduced UI memory load
-
Improved scroll performance
ViewHolder Optimization
-
Removed redundant bindings
-
Used stable IDs for better performance
-
Preloaders for image-heavy items
Layout Optimization
-
Replaced nested views
-
Enabled
setHasFixedSize(true) -
Considered using ListAdapter for auto-diffing
Result:
-
Smooth scrolling across all lists
-
Lower CPU usage during rendering
-
Faster updates when data changes
4. Memory Leak Detection & Fixes with LeakCanary
We integrated LeakCanary for runtime leak detection:
Detected and resolved leaks from:
-
Anonymous inner classes
-
Activity and fragment references
-
Long-lived listeners
-
Coroutines/Threads not cancelled
-
Singleton holding context
-
Unreleased adapters and views
After fixes:
-
Memory footprint dropped
-
Reduced OutOfMemory crashes
-
Improved long-session stability
Additional Performance Improvements
1. Network Optimization
-
Added caching
-
Reduced over-fetching
-
Consolidated redundant API calls
2. Image Loading Optimization
-
Optimized Glide/Coil configs
-
Added placeholders and preloading
-
Enabled memory/disk caching strategies
3. Background Task Optimization
-
Used WorkManager for scheduled tasks
-
Ensured proper cancellation of unused tasks
4. Code Refactoring
-
Removed unused dependencies
-
Updated old libraries
-
Replaced heavy implementations with lightweight ones
Architecture Improvement Summary
Results & Impact
Smaller App Size
APK reduced by 25–45%.
Faster Startup
Launch time improved significantly due to deferred initialization.
Smooth UI and Lists
RecyclerView became responsive even on large data sets.
Improved Stability
Memory leaks fixed; fewer crashes reported.
Better User Experience
App became faster, smoother, and more reliable overall.
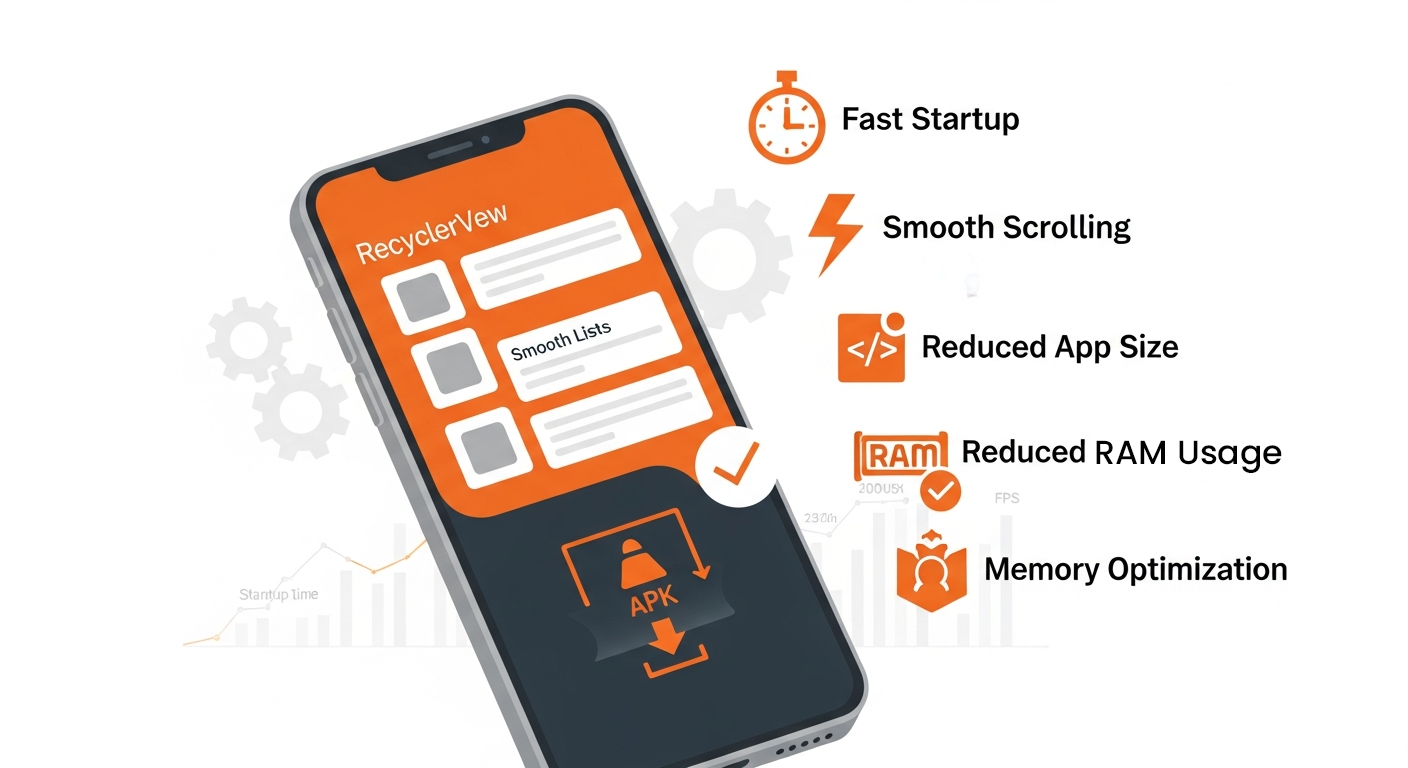
Conclusion
Through a combination of R8/ProGuard optimization, startup profiling, RecyclerView enhancements, and memory leak resolution, we delivered a noticeably faster, lighter, and more stable Android application.
This performance overhaul improved user experience dramatically and prepared the app for future growth.